Dashboards
Probiz software provides a dashboard for each of its core modules, which helps managers monitor team performance, track data, and ensure accountability. These dashboards offer real-time insights through visual analytics and customizable reporting tools Examples are below:
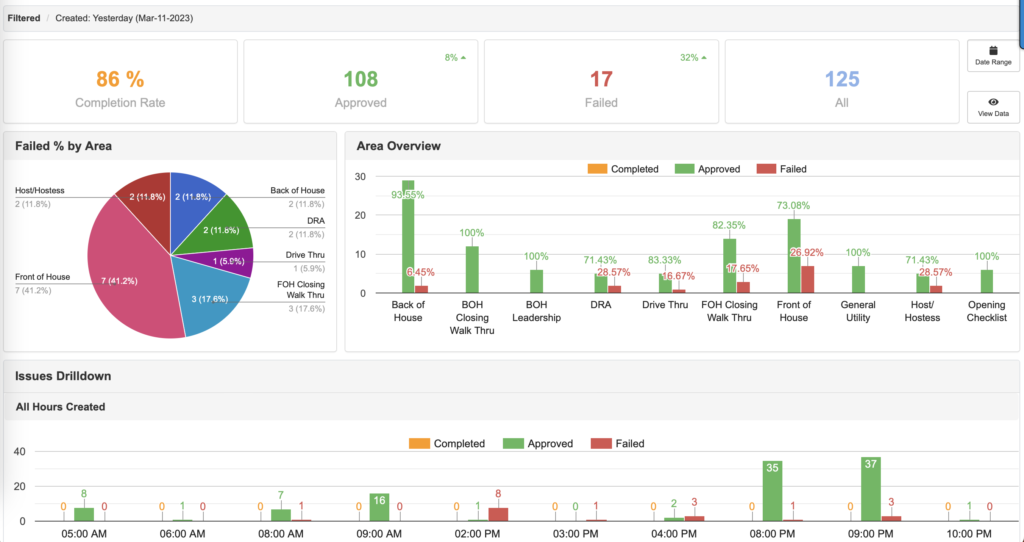
The Checklist Dashboardholds your team accountable for tasks completion while providing a performance overview by area or position.
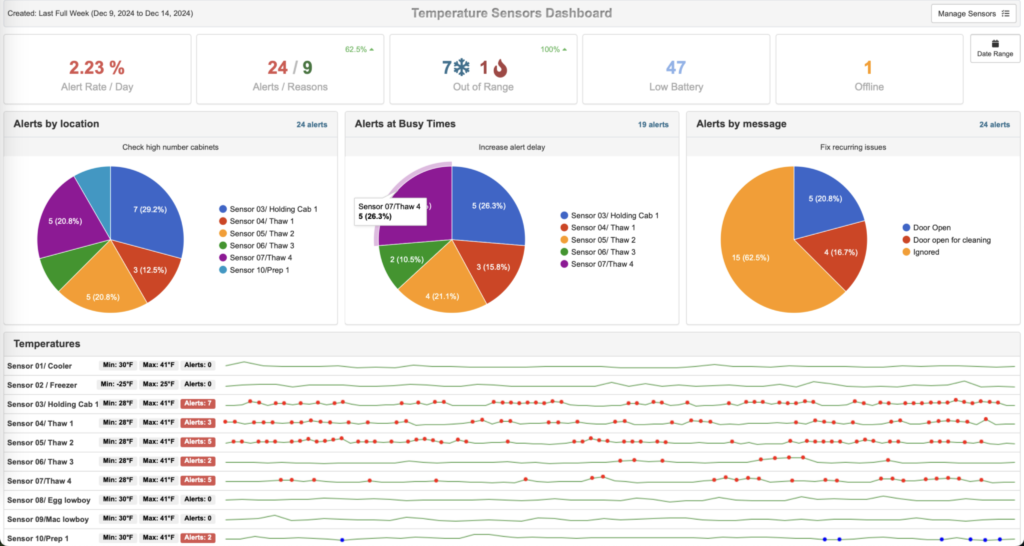
The Cooler Alert Dashboardshows sensor trends so issues can be addressed before food loss or a food safety issues.
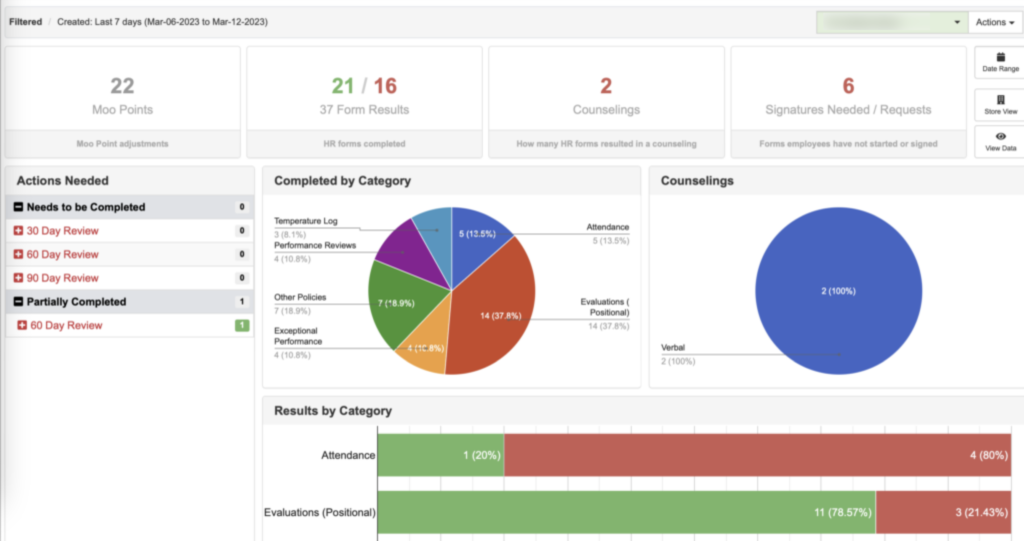
The HR Dashboardshows the team performance over time showing strengths & weakness within the store.
The Tracker dashboard shows the performance of the team while providing an overview of how lean your store is.

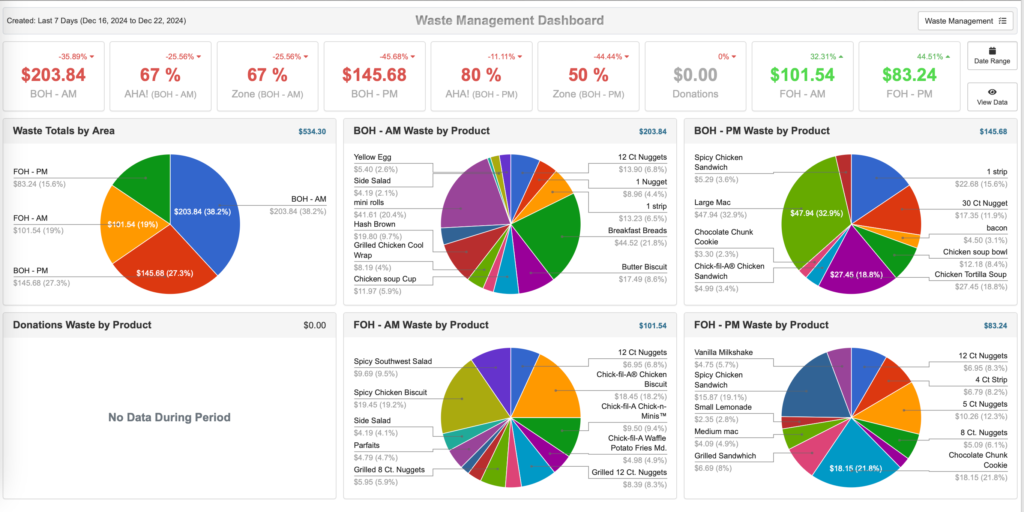
The Waste Management Dashboard displays a pie chart showing waste reports allowing management to monitor store waste.
The Walkthrough Dashboarddisplays a pie chart showing the store performance of the store walkthroughs.

