Dashboards
Each Module has a revolutionary dashboard system that allows you to see the performance of your team In depth. Examples are below:
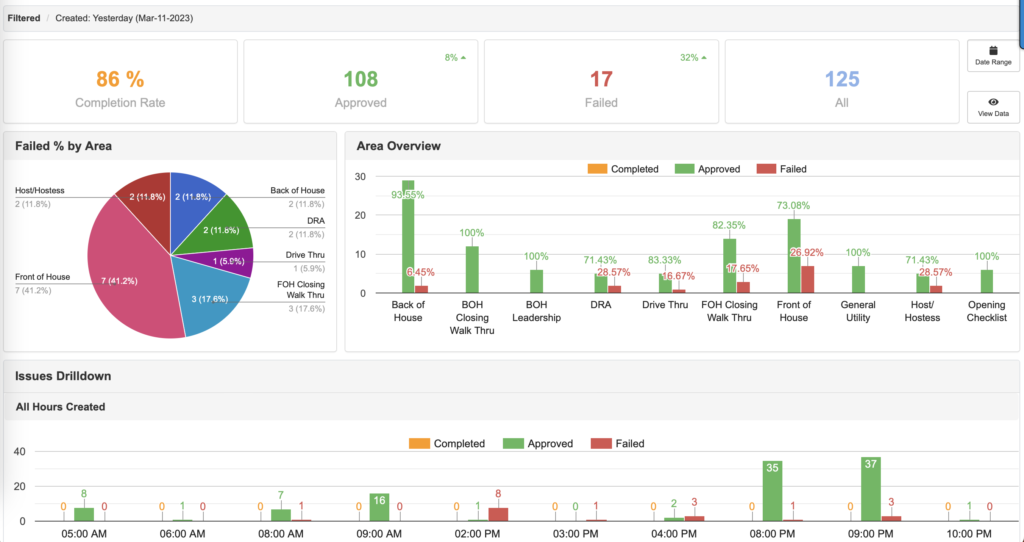
The Checklist Dashboard–holds your team accountable for tasks completion while providing a performance overview by area or position.
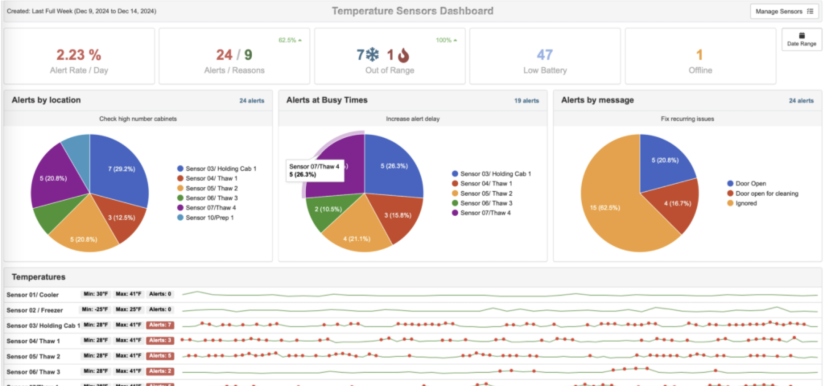
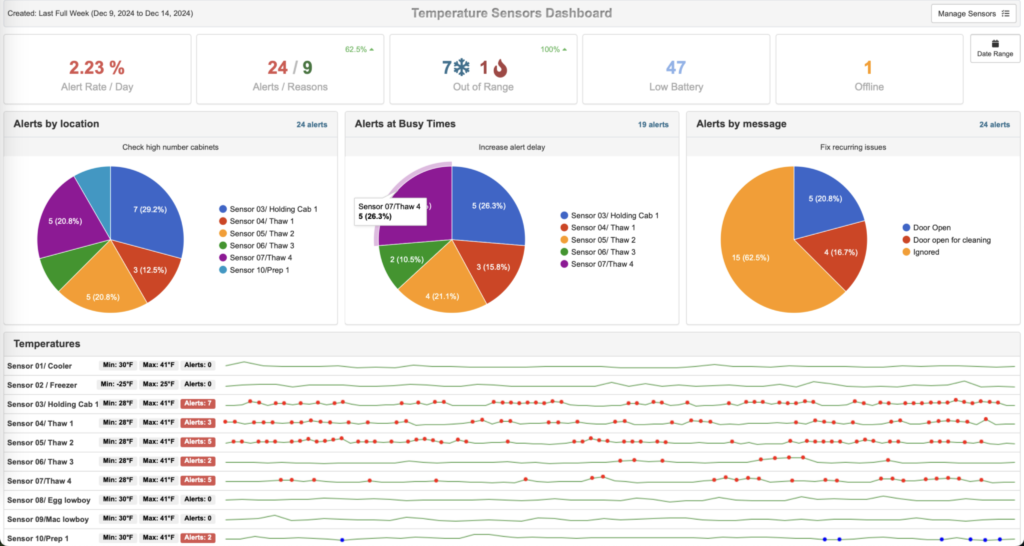
The Cooler Alert Dashboardshows sensor trends so issues can be addressed before food loss or a food safety issues.
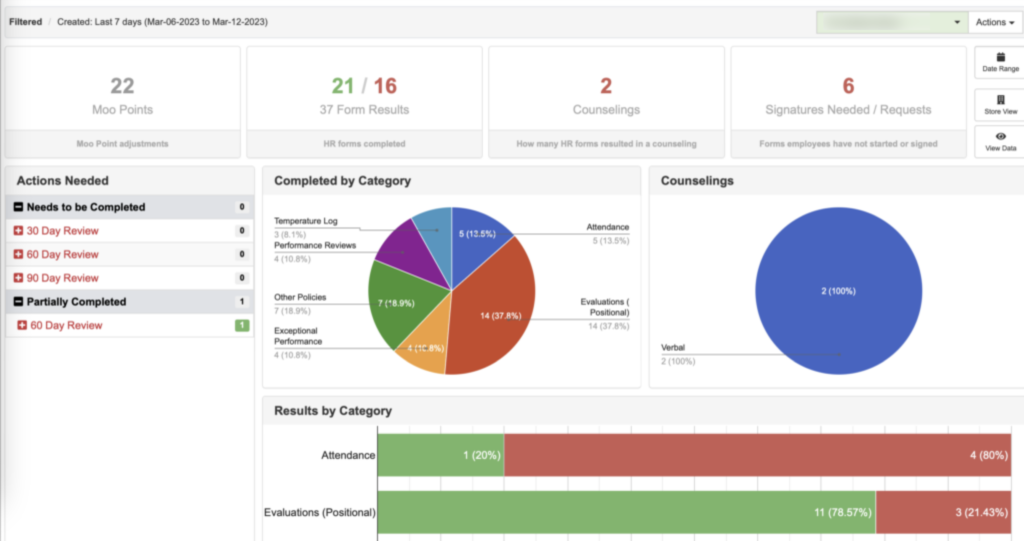
The HR Dashboardshows the team performance giving full visibility to those in charge. Team member scores are used to update the dashboard showing strengths & weakness within the store.
The Tracker dashboard is used to keep your store lean and food safe. The dashboard shows the performance of the team while providing an overview of how lean your store is.

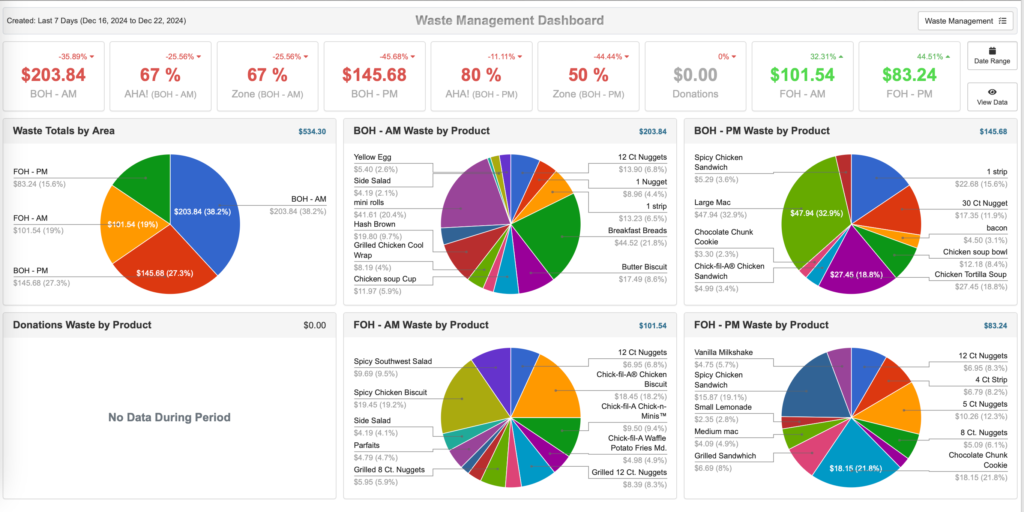
The Waste Management Dashboard: displays a pie chart showing waste reports allowing management to monitor store waste.